Quick Comparison
| Evernest | ProjectionLab | |
|---|---|---|
| Price | $3.99/mo annual ($47.88/yr) or $7.99/mo monthly | $129/yr Premium (7-day free trial) Free Basic plan; $1,199 lifetime option |
| AI on your data? | No | No |
| Account linking | None | None |
| Monte Carlo | Up to 50,000 scenarios with histograms ($48/yr) | Up to 10,000 scenarios (Premium) |
| Setup | Guided wizard, presets, helper screens — minutes | Manual configuration — plan for an afternoon |
| Free tier | Full projection engine — simple scenarios free forever, data saved | Forecasting + Monte Carlo, but cannot save plans |
| Portfolio approach | Portfolio total + type + your inflation/tax rates — projects your money, not individual holdings | Individual account and asset-level modeling |
| Core output | Year-by-year cash flow chart, Monte Carlo histograms, multiple portfolios, detailed data tabs | Net worth projections, cash flow, tax analytics, Compare Mode |
Competitor prices as of October 2026 — check ProjectionLab's site for current pricing.
What These Tools Have in Common
Before the differences: ProjectionLab and Evernest agree on the fundamentals. Both tools skip AI, skip account linking, and skip advisory upsells. Neither sells your data. Neither asks for your bank credentials. In a market where most retirement planners want to connect to your accounts and run AI on your finances, both Evernest and ProjectionLab say: you enter the numbers, the engine does the math, you make the decisions.
That shared philosophy means this comparison isn't about trust or safety — both tools respect your data. It's about how much complexity you need, how much you want to spend, and how fast you want to get to your first projection.
Guided Simplicity vs. Manual Control
ProjectionLab is built for people who want to configure everything themselves. You model individual accounts, specific asset allocations, tax-lot-level detail, and granular withdrawal strategies. It's powerful — and it expects you to know what you're looking for.
Evernest takes a different approach. It doesn't project your individual investments — it projects your money, invested in various portfolio types, and how those portfolios perform long-term based on historical data. You enter your portfolio total, pick a type (traditional, fixed income, income investing), set your inflation rate and tax rate once, and the engine does the rest. No individual stock listings. No asset-by-asset allocation. Just the numbers that actually drive your retirement projection.
Evernest: Up and Running in Minutes
Walk through a few focused screens — age, savings, spending, income. No guessing what to fill in next.
Common situations pre-filled with one click. Start from a template that matches you, then adjust what matters.
Each input has context — what it means, what's typical, why it matters. No jargon, no guessing.
Your year-by-year chart updates as you enter data. No “save and run” step — the picture builds live.
Most people have their first complete retirement projection within 5 minutes. ProjectionLab's own documentation suggests planning an afternoon for initial setup.
This isn't a criticism of ProjectionLab — the depth is the point. But if you're asking “will my money last?” and don't want to model each brokerage account individually, Evernest gets you there faster with less friction.
Monte Carlo: 50,000 vs. 10,000 Scenarios
Both tools include Monte Carlo simulation — the gold standard for stress-testing a retirement plan against unpredictable markets. But the implementation differs.
Evernest
- • Up to 50,000 randomized scenarios
- • Full histogram output showing distribution
- • Percentile breakdowns (median, 10th, 90th)
- • Included at $48/year
ProjectionLab
- • Up to 10,000 scenarios
- • Customizable success/failure thresholds
- • Drill into individual trial paths
- • Included in Premium
More scenarios means a more statistically stable result. At 50,000 runs, Evernest's success probability and percentile outcomes converge more tightly — you're less likely to see your results shift between runs. ProjectionLab's 10,000 is still statistically sound, but Evernest gives you 5x the simulation depth at less than half the price.
The Price Gap
Both tools take the same philosophical stance on privacy and data ownership. But the price difference is significant:
Annual Cost Comparison
If you prefer to pay monthly, Evernest is $7.99/month with no annual commitment. ProjectionLab doesn't offer a monthly option — it's billed annually, with a lifetime option.
The question is whether ProjectionLab's additional depth — individual asset modeling, tax analytics, Compare Mode — is worth more than twice the price for your situation. For most people asking the core retirement questions, the answer is no.
Free Tier: A Real Difference
Both tools offer free plans, but they're very different in practice.
Evernest Free
- ✓ Full projection engine
- ✓ Your data is saved
- ✓ Simple scenarios free forever
- ✓ Upgrade only for advanced features
ProjectionLab Free
- ✓ Forecasting and Monte Carlo
- ✗ Cannot save your plans
- ✗ No tax estimation
- ✗ No scenario comparisons
ProjectionLab's free tier is essentially a demo — useful for kicking the tires, but you can't save your work and come back to it. Evernest's free plan gives you a fully functional retirement projection that you can save, revisit, and update as your situation changes. You only pay when you want advanced features like Monte Carlo simulation and multiple portfolios.
Data Safety: Common Ground
This is where Evernest and ProjectionLab genuinely agree. Both tools take data privacy seriously:
- ✓No linking to financial institutions
- ✓No AI processes your financial data
- ✓No advisory upsell or data brokering
- ✓Neither tool sells your data
If data safety is your top priority, you can't go wrong with either tool. The decision comes down to how much you want to spend, how much setup you want to do, and whether you need individual asset-level modeling. Read Evernest's full privacy policy →
Where ProjectionLab Wins
Honest comparison — here's where ProjectionLab has an edge:
- •Tax analytics: ProjectionLab models detailed tax impacts — Roth conversion strategies, ACA subsidy optimization, and international tax presets. If tax optimization is central to your plan, ProjectionLab goes deeper.
- •Compare Mode: Side-by-side scenario comparison with visual overlays. Evernest supports multiple scenarios but doesn't overlay them on a single chart.
- •FIRE community: ProjectionLab has a strong Bogleheads and FIRE community following, with an active Discord. If community discussion is important to you, ProjectionLab has a head start.
- •Individual asset modeling: If you want to model each brokerage account, each fund, each asset class separately, ProjectionLab lets you get that granular.
If you're deep into tax optimization or the FIRE movement, ProjectionLab is a solid product with a loyal following. But if you want the core retirement questions answered without the complexity — keep reading.
Where Evernest Wins
Evernest isn't a simpler tool — it's a different philosophy. Less configuration, same depth of insight, at a fraction of the cost.
Monte Carlo Simulation
50,000 randomized scenarios — 5x ProjectionLab's 10,000. Full histogram output showing the distribution of outcomes, percentile breakdowns, median and worst-case ending balances. Included at $48/year — less than half the price of ProjectionLab Premium.
Multiple Portfolios
Model multiple portfolios with independent return assumptions. Traditional, fixed income, income investing — each with its own draw strategy and draw order. No individual stock listings required — just the total and expected return range.
Detailed Data Views
Full data tabs showing year-by-year breakdowns of portfolio balances, income sources, spending, Social Security, and financial events. The actual numbers behind the chart, every year, so you can verify the math yourself.
Financial Events
Model one-time and recurring events: home sales, inheritances, college tuition, car purchases, Roth conversions — anything that changes your cash flow in a specific year. See exactly how each event impacts your long-term picture.
Visual Cash Flow Chart
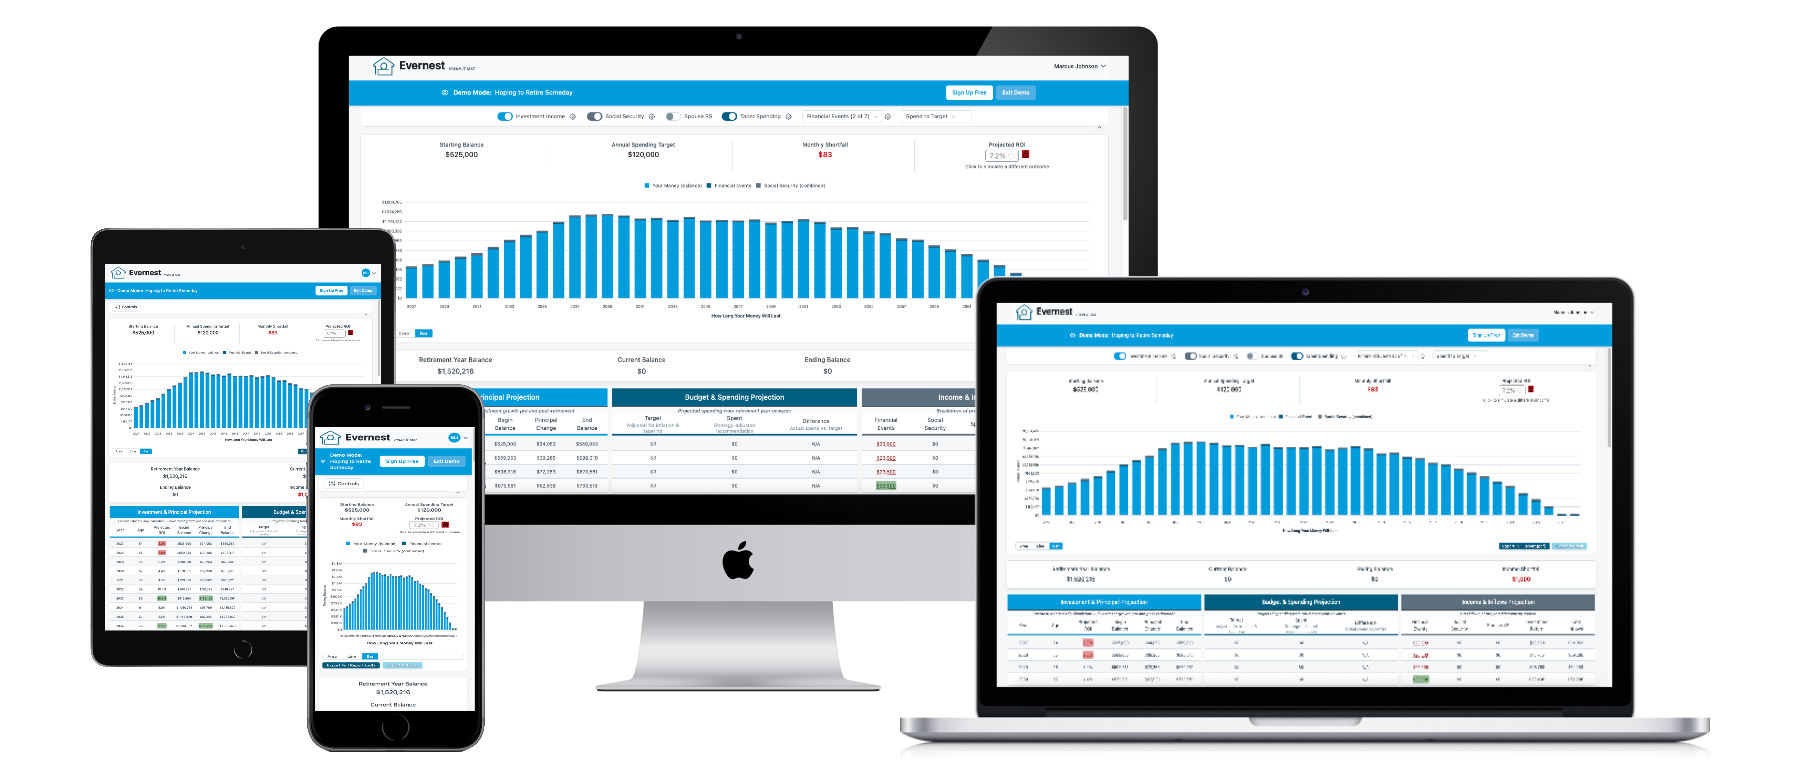
Year-by-year stacked bar chart showing portfolio balance, Social Security, and other income against spending. See at a glance when money runs out, where income overlaps, and where the pressure points are.
Spend Tapering
Model realistic spending patterns — most retirees spend less as they age. Configure spending to step down so your projection reflects how people actually live, not a flat line that overstates late-retirement costs.
- ✓Price: $47.88/year — less than half the price of ProjectionLab Premium, with every feature listed above included.
- ✓5-minute setup: Guided wizard with presets and helper screens vs. manual configuration that can take hours.
- ✓Free tier that saves: Your free plan data persists — come back anytime. ProjectionLab's free tier can't save.
- ✓5x Monte Carlo depth: 50,000 scenarios vs. 10,000 — more statistically stable results at a lower price.
The Bottom Line
Choose Evernest if:
- → You want clear answers without configuring every detail
- → You want 50K Monte Carlo scenarios at $48/year
- → You want a free tier that actually saves your data
- → You value guided simplicity over manual control
- → You don't need individual asset-level modeling
Choose ProjectionLab if:
- → Tax optimization is central to your retirement strategy
- → You want to model each account and asset individually
- → You want side-by-side scenario comparison (Compare Mode)
- → You're active in the FIRE community and want Discord support
Not Ready to Sign Up? Try a Free Calculator
Get a quick answer to your biggest retirement question — no account required:
See Your Retirement Projection in 5 Minutes
Same privacy-first philosophy as ProjectionLab — at less than half the price, with 5x the Monte Carlo depth, and a guided setup that gets you answers in minutes.
Related Comparisons
Evernest vs. Boldin
About a third of Boldin's price. No AI vs AI on your data. Visual simplicity vs 250 input fields.
Evernest vs. a Financial Planner
When DIY software makes sense vs. hiring a professional — and how much you save.
Evernest vs. MaxiFi
Visual cash flow charts vs. consumption smoothing. About a third of MaxiFi's price.