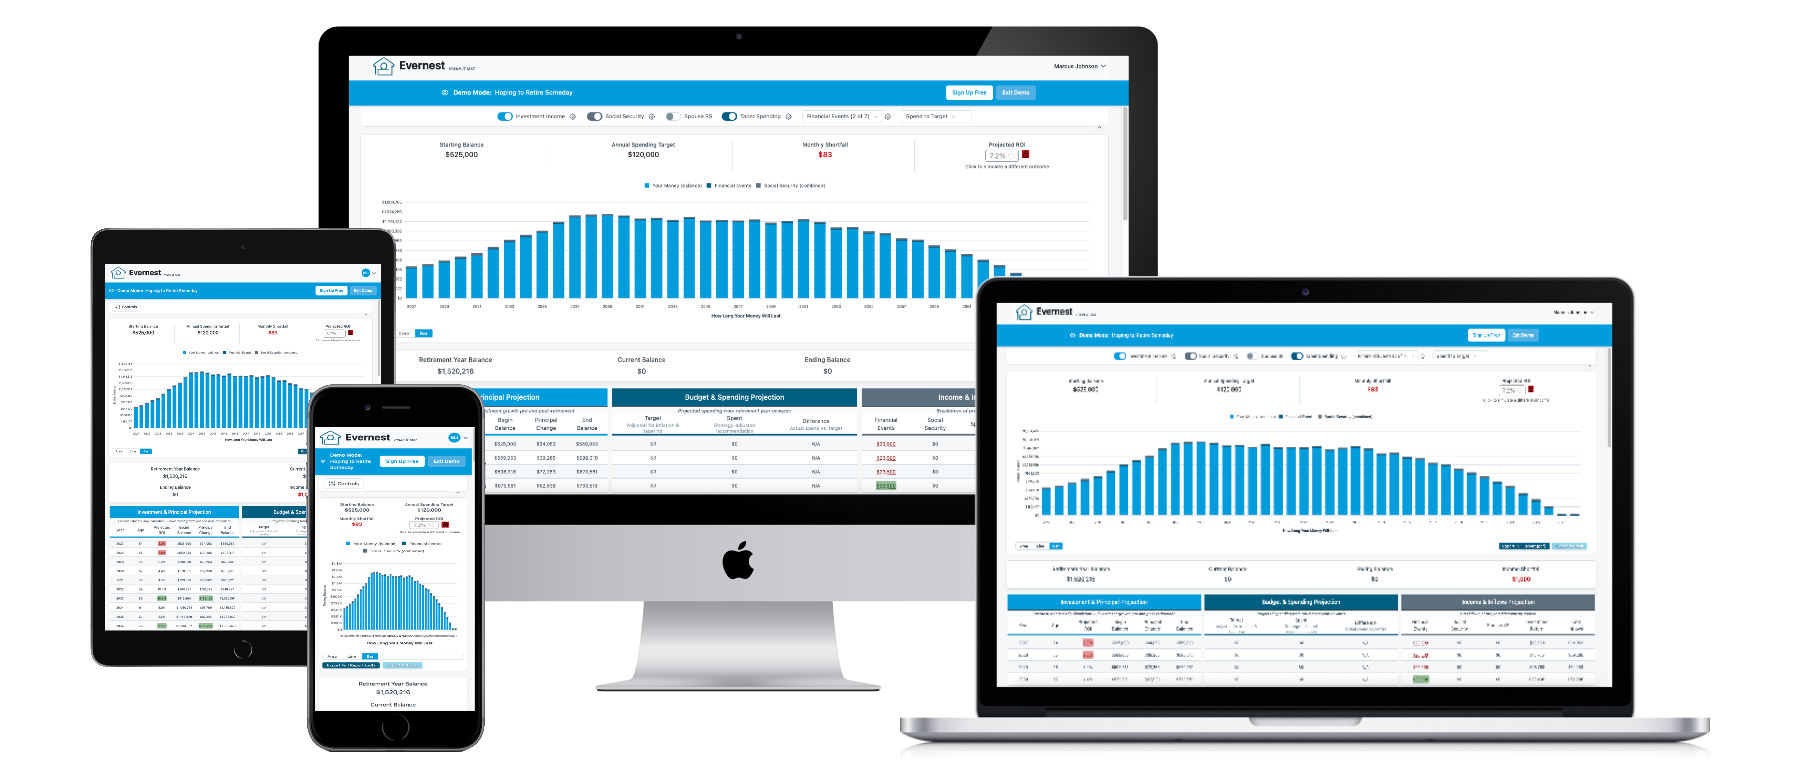
Your Income Portfolio Deserves a Real Projection
Most retirement calculators treat your savings as a single lump sum that gets drawn down over time. They assume you'll sell shares to fund retirement — the classic 4% rule approach. But that's not how income investors think. You've built a portfolio designed to generate cash flow: dividends from equities, coupons from bonds, distributions from REITs and funds. Your plan isn't to sell the goose — it's to live off the eggs.
Evernest understands this distinction. Instead of treating your portfolio as a piggy bank to crack open, you can model the income your investments produce and see whether that income — combined with Social Security, pensions, and other sources — actually covers your annual spending. If it does, your principal stays intact. If there's a gap in specific years, you see exactly when and how much.
This is the projection income investors have been asking for: not "when does my money run out?" but "does my income cover my expenses, and if not, in which years do I need to dip into principal?"
Model Dividends, Bonds, and Fixed Income Alongside Social Security
Income investing in retirement isn't just about dividends. It's the full stack of passive cash flow: dividend-paying stocks and funds, bond interest and coupons, REIT distributions, annuity payments, pension income, and Social Security. Each source has its own start date, yield characteristics, and reliability. The question is whether they add up to enough.
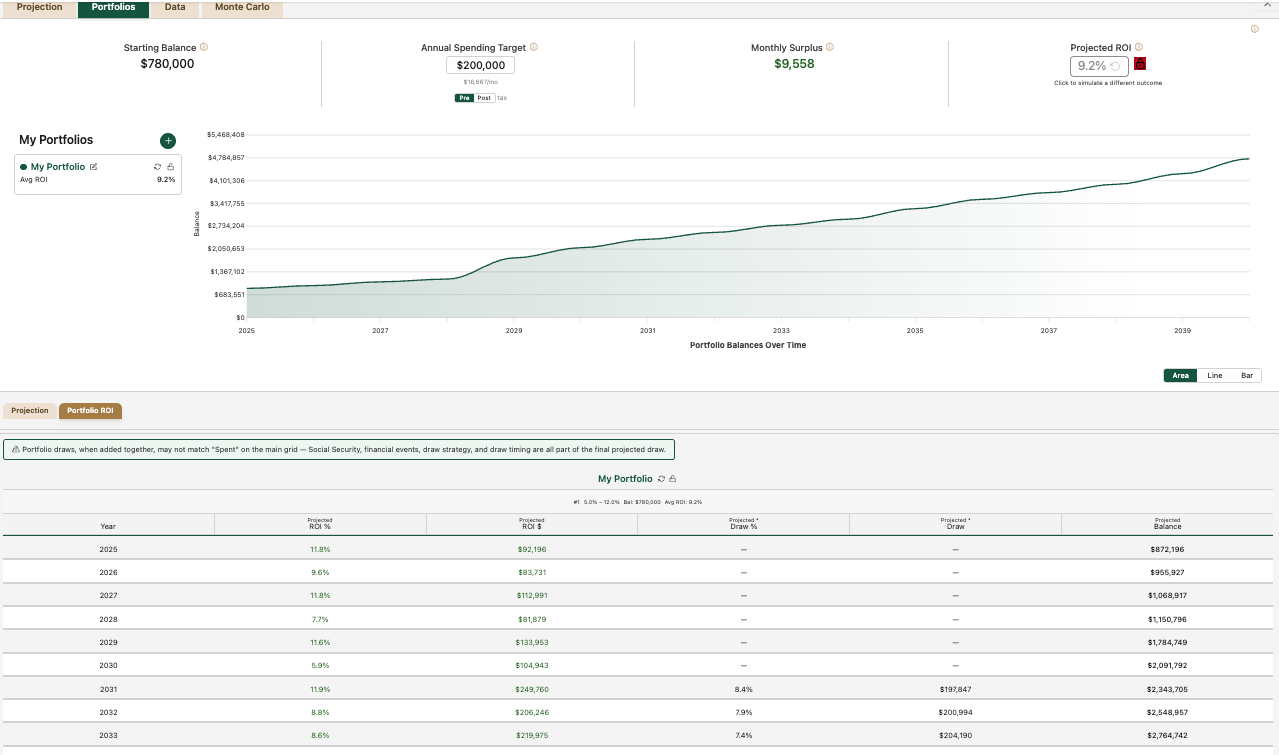
Evernest lets you layer these income sources into your projection. Model your dividend income as a recurring financial event — say $35,000 per year starting at retirement. Add your Social Security benefit at age 67. Include bond interest from a fixed income allocation. Then set your annual spending target and let the projection show you the math, year by year.
The power is in the details. Maybe your dividend income covers 60% of spending at age 65. Social Security kicks in at 67 and now you're at 95%. By 70, with delayed Social Security at its maximum, your passive income exceeds your spending — and your portfolio starts growing again instead of shrinking. That's the income investor's dream scenario, and Evernest shows you exactly whether your numbers support it.
Test Yield Scenarios With Monte Carlo Simulation
Income investors know that yields aren't static. Dividend payouts fluctuate. Bond yields change with interest rates. REIT distributions can be cut during downturns. A retirement plan built on a single assumed yield is fragile — you need to test a range of outcomes.
Evernest's variable yield modeling lets you set a realistic range for your portfolio returns — for example, 3% to 7% for an income-focused portfolio — and then generates randomized year-by-year scenarios within that range. Instead of seeing one optimistic projection, you see what happens when yields are strong, average, and weak. You can regenerate scenarios instantly to test different sequences: what if the weak years come early in retirement when your portfolio is at its largest?
This is especially critical for income investors because sequence-of-returns risk affects you differently than total-return investors. If your dividends get cut during a downturn, you might be forced to sell shares at depressed prices to cover spending — exactly the scenario you designed your income portfolio to avoid. Evernest's scenario modeling reveals these vulnerabilities before they happen, not after.
See the Income Gap — and Close It
The income gap is the difference between what your passive income produces and what you need to spend. In the early years of retirement — before Social Security starts, before pension benefits kick in — the gap is typically at its widest. This is the danger zone for income investors: the period when you're most likely to sell shares.
Evernest makes this gap visible for every year of your retirement. You can see exactly how large the shortfall is at age 62, 65, 67, and 70 — and test strategies to close it. Add part-time consulting income for the first three years. Delay Social Security to 70 for a larger benefit. Increase your income allocation temporarily. Each change recalculates the entire timeline instantly.
For many income investors, the insight is surprising: the plan doesn't need more savings — it needs better timing. Bridging a three-year income gap with part-time work or a slightly delayed retirement can be the difference between a plan that requires selling shares and one that never does.
Growth + Income: Model a Blended Portfolio Strategy
Many sophisticated retirees don't choose between growth and income — they use both. A common approach: an income-producing portfolio covers essential expenses (housing, food, healthcare, insurance) while a growth portfolio handles discretionary spending and provides inflation protection over 30+ years.
With Evernest, you can model this blended approach. Set your income portfolio's yield range conservatively — maybe 3% to 5% — and your growth portfolio's range more aggressively — 6% to 12%. Layer in Social Security and see whether your essential expenses are covered by income alone, with the growth portfolio as a buffer for everything else.
This kind of bucketed analysis is what financial advisors charge thousands for. Evernest gives you the same year-by-year visibility at a fraction of the cost — and you can adjust the assumptions yourself, instantly, without scheduling another meeting or waiting for a revised report.
Built for How Income Investors Actually Think
Income investors measure success differently. It's not about total portfolio value — it's about cash flow coverage. Can my passive income cover my bills? In which years does it fall short? How much margin do I have if dividends get cut 20%? What's my floor if I only count the most reliable income streams?
Evernest's projection table answers these questions directly. Every year shows your total inflows (dividends, Social Security, pensions, other income), your spending, and the surplus or deficit. You can see your portfolio balance growing or shrinking based on the income math — not abstract withdrawal rate calculations.
Whether you're running a dividend growth strategy, a high-yield bond ladder, a REIT income portfolio, or a mix of all three, Evernest models how your income strategy plays out across a full 30-year retirement. No other retirement calculator gives income investors this level of year-by-year visibility at this price point.
Frequently Asked Questions
Can I retire on dividend income alone?
It depends on your portfolio size, dividend yield, and annual spending. If your dividend and fixed income streams plus Social Security exceed your annual spending, you never need to sell a single share. Evernest lets you model this exact scenario — enter your income sources and spending target, and the year-by-year projection shows whether your income covers expenses or whether you need to draw down principal in specific years.
How do I model dividend income in a retirement calculator?
In Evernest, you can model dividend and distribution income as recurring financial events with specific start ages, amounts, and durations. Set up your dividend income stream, your Social Security benefit, and your annual spending target — then see year-by-year whether your passive income covers your expenses. You can test different yield scenarios to see how changes in dividend rates affect your long-term plan.
What is the difference between total return and income investing for retirement?
Total return investing focuses on growing the overall portfolio value through price appreciation and reinvested dividends, then selling shares to fund spending. Income investing prioritizes generating cash flow from dividends, bond coupons, and distributions — aiming to live off the income without selling the underlying investments. Many retirees use a blend: an income-producing portfolio for essential expenses and a growth portfolio for discretionary spending and inflation protection.
How much do I need invested to live off dividends in retirement?
Divide your annual income gap (spending minus Social Security and pensions) by your expected dividend yield. If you need $40,000 per year and expect a 4% yield, you need roughly $1,000,000. But yields fluctuate, inflation erodes purchasing power, and your spending changes over time. Evernest models these dynamics year by year so you can see whether your income portfolio truly sustains your plan through age 90 and beyond.
Should I use a dividend strategy or the 4% rule for retirement withdrawals?
They're not mutually exclusive. The 4% rule is a total-return withdrawal strategy — you sell 4% of your portfolio regardless of where the return comes from. A dividend strategy aims to spend only the income without touching principal. Many income investors prefer the psychological comfort of never selling shares, while total-return advocates argue that focusing on yield alone can reduce diversification. Evernest lets you model either approach — or both — and compare the outcomes over 30+ years.
Related Resources
Retirement Income Calculator
Estimate income from every source and see your total retirement income year by year.
Retirement Income Projections
Long-range income projections showing how your cash flow evolves through retirement.
Safe Withdrawal Rate Calculator
Find the withdrawal rate that keeps your portfolio alive for 30+ years.
Retirement Distribution Planning
How withdrawal order, RMDs, and taxes fit together in retirement.
See If Your Income Portfolio Sustains Your Retirement
Model your dividend income, bond yields, and Social Security together. See the income gap for every year — and whether you ever need to sell a single share.
No credit card required · USA-based & hosted · No signup needed for demo