Why Average Returns Are Not Enough
Most retirement calculators assume a single average annual return — say 7% — and project your balance forward in a smooth, predictable curve. The result looks reassuring: your money lasts, your spending is covered, and everything works out. But markets don't deliver smooth 7% returns. They deliver 22% one year, negative 15% the next, 3% the year after, and a crash right when you start withdrawing.
The order of returns matters enormously for retirees. A 30% drop in year one of retirement is fundamentally different from a 30% drop in year twenty — even if the average return over the full period is the same. This is called sequence-of-returns risk, and it is the single biggest threat to retirement plans that look fine on paper.
A Monte Carlo simulation solves this by testing your plan against thousands of different return sequences. Instead of one path forward, you get ten thousand paths — some with early crashes, some with sustained growth, some with sideways markets that grind down your balance through withdrawals alone. The percentage of paths where your money survives is your probability of success.
How the Simulation Works
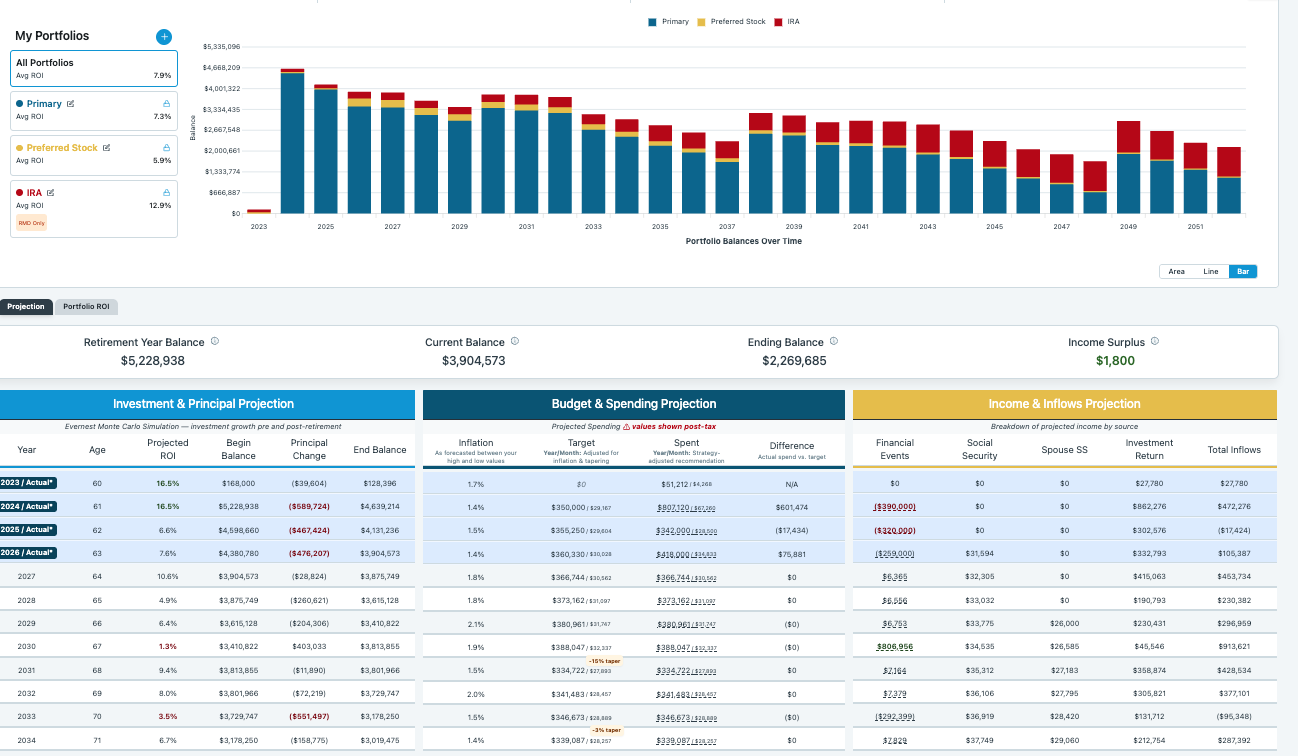
Evernest's Monte Carlo engine runs your complete retirement projection — with all your portfolios, draw strategies, financial events, Social Security, and spending rules — thousands of times. Each iteration randomizes two key variables: investment returns for each portfolio (within the yield range you've configured) and the inflation rate (within your configured range).
This isn't a simplified model. Each iteration runs the same full projection engine that powers your main dashboard. Your draw order, your never-draw portfolios, your spending tapering, your one-time financial events — all of it is included in every single scenario. The only things that change are the market returns and inflation, which is exactly what's uncertain in real life.
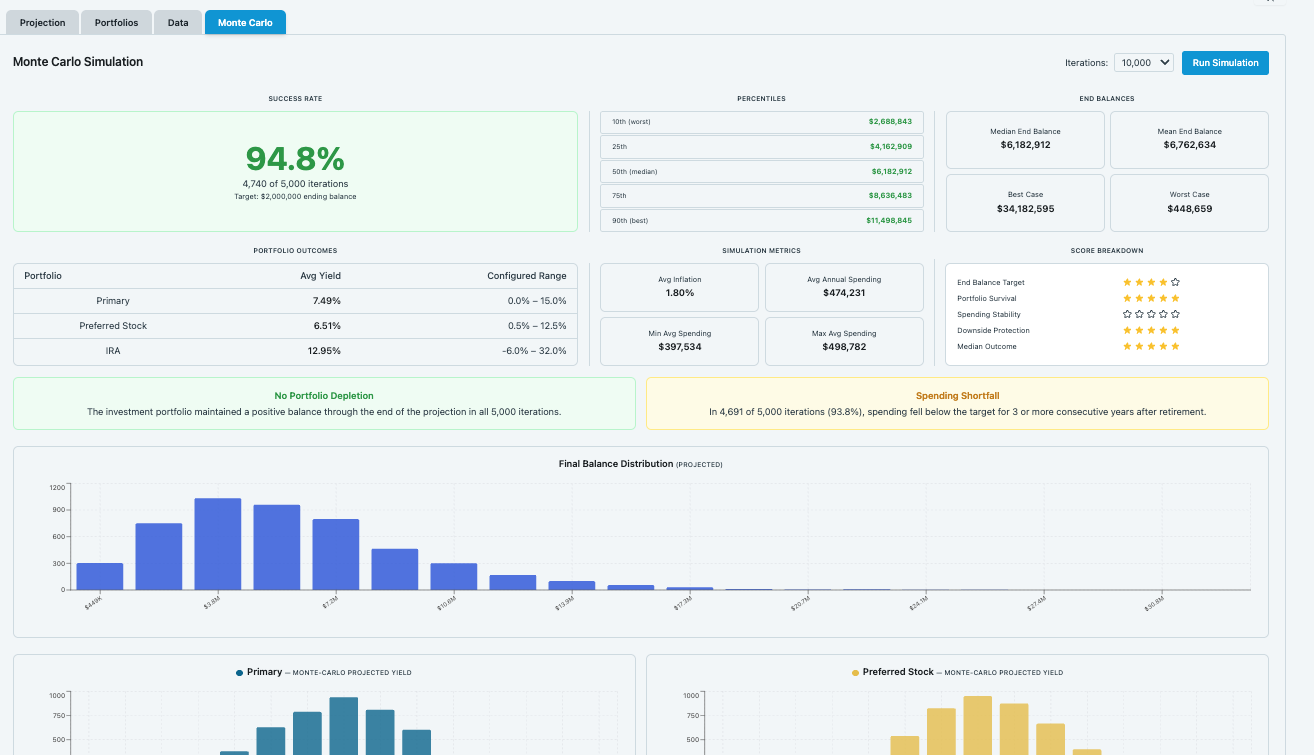
After all iterations complete, Evernest aggregates the results into actionable statistics: your overall success rate, percentile end balances (10th, 25th, 50th, 75th, 90th), the percentage of scenarios where your money ran out, average portfolio yields across all runs, and a spending shortfall indicator that tracks how often your spending fell significantly below target.
Understanding Your Results
The headline number is your success rate — the percentage of scenarios where your ending balance meets or exceeds your desired end balance. But the percentile breakdown is where the real insight lives. Your 10th percentile outcome shows what happens in a bad-but-not-catastrophic scenario. Your 90th percentile shows what happens when markets cooperate. The gap between them tells you how sensitive your plan is to market performance.
A wide gap means your plan is heavily dependent on strong returns — it works beautifully in good markets but struggles in bad ones. A narrow gap means your plan is robust: it survives poor markets and simply does better in good ones. Most people want to shrink that gap by adjusting their spending, delaying retirement, or allocating differently across portfolios.
Evernest also shows you the average yield generated for each portfolio across all iterations, alongside the configured yield range. This lets you verify that the simulation is testing the scenarios you intended. If your growth portfolio's average yield across 10,000 runs is 6.8% and you configured a range of 3% to 11%, you know the randomization is working correctly and your results reflect a realistic distribution of outcomes.
Multi-Portfolio Simulation
Unlike simplified Monte Carlo tools that treat your savings as a single lump sum, Evernest simulates each portfolio independently. Your growth portfolio gets its own randomized return range. Your fixed-income portfolio gets its own. Your IRA might be set to never-draw — meaning the simulation only taps it as a last resort when all other portfolios are depleted.
This matters because your portfolio allocation strategy changes how your plan responds to market stress. A plan with 80% in growth and 20% in bonds behaves very differently under a 2008-style crash than a plan with 50/50 allocation. And a plan with a dedicated never-draw IRA behaves differently from one where all portfolios are drawable. Evernest's simulation captures these differences because it runs your actual strategy, not a simplified version of it.
The per-portfolio yield summary in the results panel shows you the average return each portfolio generated across all iterations, along with the configured low and high range. This helps you understand which portfolio is contributing the most variability to your results and where you might want to tighten the range for a more conservative estimate.
Run Your First Simulation
Evernest is free to start with no credit card required. Set up your portfolios, configure your retirement assumptions, and run a Monte Carlo simulation in minutes. Start with 1,000 iterations for a quick estimate, then run 10,000 for a high-confidence result. Your simulation history is saved so you can track how plan changes affect your probability of success over time.
Every change you make to your plan — adjusting your spending, adding a financial event, changing your retirement date, reconfiguring a portfolio's yield range — can be stress-tested with a new simulation run. This is how you move from hoping your plan works to knowing the probability that it will.
Frequently Asked Questions
What is a Monte Carlo simulation for retirement?
A Monte Carlo simulation tests your retirement plan against thousands of randomized market scenarios. Instead of assuming a single average return, it generates a range of possible outcomes — some with strong markets, some with crashes, some with high inflation — and shows you what percentage of those scenarios leave you financially secure. The result is a probability of success rather than a single number.
How many simulations should I run?
Evernest lets you run up to 50,000 iterations per simulation. For a quick check, 1,000 iterations gives you a reasonable estimate. For a high-confidence result, 10,000 is the sweet spot — the probability stabilizes and you get reliable percentile breakdowns. Running 50,000 is useful when you want to study the extreme tails.
What is a good Monte Carlo success rate for retirement?
Most financial planners consider 80% or higher a solid result, and 90%+ as very strong. Below 70% suggests meaningful risk. But context matters — a 75% rate with a large desired end balance might be fine if you're flexible on that target, while an 85% rate with zero margin for spending cuts could be riskier than it looks.
Does the simulation account for inflation?
Yes. Each iteration randomizes inflation within a range you configure. Some scenarios test low-inflation environments, others test sustained high inflation. The simulation averages panel shows you the mean inflation rate across all iterations.
Related Resources
Retirement Stress Test
See how market crashes, inflation spikes, and bad timing affect your retirement.
Scenario Planning Tool
Compare retirement dates, spending levels, and income strategies side by side.
Withdrawal Calculator
Test different withdrawal rates and see how long your savings will last.
Safe Withdrawal Rate Calculator
Find the withdrawal rate that balances lifestyle and longevity for your situation.
Stress Test Your Retirement Plan
Run thousands of market scenarios against your actual retirement settings. Know your probability of success before you retire — not after.
No credit card required · No signup needed for demo